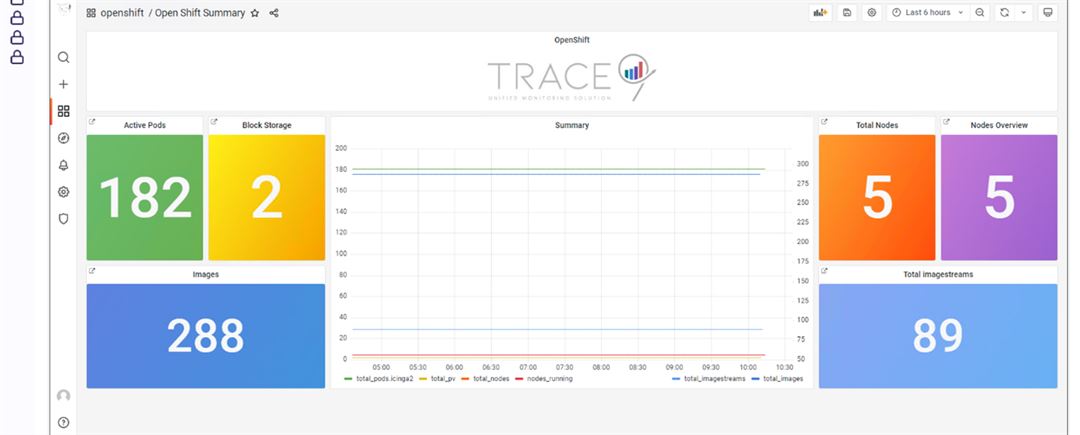
Overview
The Openshift Monitoring Module for Trace9® is designed to monitor the health and performance of multiple Openshift clusters. It collects data from all resources of the Openshift infrastructure using custom scripts that utilize the “oc” cli and sends this data to icinga for analysis and visualization in Grafana. This module requires an OCP client to be installed on the Trace9® stack/satellite.
Features
Here are some of the features of Trace9® Open Shift Monitoring:
Container Monitoring
Trace9® Openshift monitoring monitors container resource usage, such as CPU and memory, and provides insights into container behavior, health, and status. This feature helps IT teams optimize container performance and ensure container availability.
Application Monitoring
Trace9® Openshift monitoring monitors application performance and availability, track metrics such as response time, throughput, and error rates, and provides insights into application behavior and issues. This feature helps IT teams ensure that applications are meeting service-level agreements and performing optimally.
Logs Monitoring
Trace9® Openshift monitoring monitors logs generated by containers, applications, and infrastructure components, and provides insights into system behavior, errors, and issues. This feature helps IT teams troubleshoot and resolve issues quickly.
Metrics Monitoring
Trace9® Openshift monitoring monitors system metrics, such as CPU, memory, and disk usage, and provides insights into system behavior, performance, and capacity. This feature helps IT teams optimize system performance and capacity planning.
Alerting and Notification
Trace9® Openshift monitoring triggers alerts and notifications when system performance or availability thresholds are breached. This feature helps IT teams respond to issues quickly and ensure system availability.
Benefits
Here are some of the benefits of Openshift monitoring:
Faster Troubleshooting
Trace9® Openshift monitoring enables IT teams to quickly identify the root cause of issues by providing insights into container behavior, application performance, and infrastructure health. This helps IT teams troubleshoot and resolve issues faster, reducing downtime and improving system availability.
Capacity Planning
Trace9® Openshift monitoring enables IT teams to monitor resource utilization and capacity usage, such as CPU and memory usage. This helps IT teams optimize resource utilization, plan for capacity needs, and ensure that the system can handle peak loads.
Improved Security
Trace9® Openshift monitoring monitors logs and network traffic and detects security threats such as malware and unauthorized access attempts. This helps IT teams detect and respond to security incidents early, reducing the risk of data loss and system downtime.
Cost Optimization
Trace9® Openshift monitoring monitors resource utilization and identify underutilized resources, helping IT teams optimize resource usage and reduce costs.
Technology Supported
- Openshift clusters of all sizes and configurations
- Linux-based environments
Protocols Supported
- HTTPS (for connecting to OCP clients)
- SSH (for connecting to Openshift nodes)
- oc cli commands for collecting metrics
Devices Supported
- Pods
- Config Maps
- Containers
- Secrets
- Nodes
- Persistent Volumes
- Services
- Persistent Volume Claims
- Deployments
- Jobs
- Replication Controllers s
- CronJobs
Module Dependency
Trace9® Openshift Monitoring module is dependent on OCP client installed on Trace9® stack/satellite Icinga, Grafana, and Openshift clusters.
For the in-development daemonset monitoring technique, the following dependencies will be required**:
Kubectl
Daemonset objects for collecting metrics
Node-exporter
Prometheus
Node.js
NPM
Helm
**It’s important to note that the specific dependencies for the daemon set monitoring technique may change as development progresses.
IP/Ports Requirements
Port 443 (HTTPS) for OCP client connection to Openshift clusters
Moreover
- Monitors health and performance metrics of all resources of multiple Openshift clusters.
- Provides visual representation of data in grafana.
- Customizable metrics collection through use of "oc" cli.
- Upcoming feature to utilize daemonsets for metrics collection.
- Actively monitor the full stack of your applications and services running on open stack.
- Monitor the performance of your entire IT with Trace9® OSM.
- Know the status of all open stack instance in real time.
- Trace9® open stack monitoring provides real-time insights into resource utilization, open stack services, availability, and log files.
- Check the availability of all connected Assets & Resources.
- Provides unlimited potential for customization and cost savings offerings.
- Identify your assets and keep a check on your IT resources with thresholds and alerts.
Scalability
The Openshift Monitoring Module for Trace9® is highly scalable, as it is designed to monitor multiple Openshift clusters. It can handle an increasing number of resources and clusters without compromising performance.

Trace9® editions difference table
This edition difference table Provides a comparison between different editions of Trace9® Monitoring Solution. It outlines the features, content, or specifications that distinguish one edition from another. The edition table helps customers make informed decisions about which edition best suits their needs or preferences.
| Trace9® Modules | Trace9® Standard | Trace9® Professional | Trace9® Advanced | Enterprise | Service Provider | |
|---|---|---|---|---|---|---|
| Legend | x = Supported - NS= Not Supported "Version upgrade will require" | |||||
| Trace9® Satellite Node | ||||||
| Network Performance Monitor (NPM) | ||||||
| NPM IOT Monitor | ||||||
| Desktop & Application Monitor | ||||||
| Server & Application Monitor | ||||||
| Virtualization Monitor | ||||||
| Database Monitor | ||||||
| Cloud Monitoring | ||||||
| HCI Monitor | NS | |||||
| Advanced Virtualization Monitor | NS | |||||
| Log Management | NS | |||||
| Software License Monitoring | NS | |||||
| ITSM Integration | NS | |||||
| Network xFlow | NS | |||||
| NF Virtualization Monitor | NS | NS | ||||
| SD-WAN Performance Monitor | NS | |||||
| Trace9® Special Integration Packs-Telco | NS | NS | NS | NS | ||
Redefining IT Performance and Security Through Intelligent Innovation.
